

Article added / Artikel hinzugefügt 01.10.2021
Generally Articles and Discussions about Osteosarcoma in Dogs
→ Evaluations of phylogenetic proximity in a group of 67 dogs with
osteosarcoma: a pilot study
Article added / Artikel hinzugefügt 01.10.2021
Generally Articles and Discussions about Osteosarcoma in Dogs
→ Canine Periosteal Osteosarcoma
Images added / Abbildungen hinzugefügt 02.05.2019
Generally Sonography Atlas of Dogs →
Cardiovascular system → Pulmonary vessels
New subcategory added / Neue Unterkategorie hinzugefügt 02.05.2019
Generally Sonography Atlas of Dogs →
Cardiovascular system → Pulmonary vessels
Images added / Abbildungen hinzugefügt 01.05.2019
Generally Sonography Atlas of Dogs →
Cardiovascular system → Heart valvular diseases


Contrast enhanced ultrasonography of kidney in conscious and anesthetized beagle dogs

CHOI, S.-Y., JEONG, W.-C., LEE, Y.-W., & CHOI, H.-J. (2016). "Contrast enhanced ultrasonography of kidney in conscious and anesthetized beagle dogs". The
Journal of Veterinary Medical Science, 78(2), 239–244.
http://doi.org/10.1292/jvms.15-0199

Abstract
Contrast enhanced ultrasound (CEUS) is useful to evaluate tissue perfusion in the kidney. In veterinary medicine, sedation or anesthesia may be required in uncooperative or panting patients. The aim of this study was to evaluate and compare the normal kidney perfusion patterns in conscious and anesthetized dogs using CEUS. Eight healthy beagles were used in this study. Scanning was performed in conscious dogs using manual restraint (conscious group), or under general anesthesia using tiletamine-zolazepam and medetomidine (TZM group) or medetomidine (M group). The contrast agent (Sonovue®) was administered as an IV bolus. The peak intensity (PI), time to peak enhancement from injection (TTP0) and the time to peak enhancement from the initial rise (TTPup), upslope, downslope and area under the curve (AUC) were analyzed. Compared to the cortical values in the conscious group, TTP0 was significantly delayed in the TZM group, and upslope, TTP0 and TTPup were significantly different in the M group. The AUCs in the TZM and M groups were not different from those in the conscious group. The upslope of renal medullary perfusion was significantly decreased in the TZM and M groups. TTP0 and TTPup were also significantly delayed in these groups. The AUC of the medulla was significantly decreased in the M group. Therefore, TZM is useful as an anesthetic protocol when performing CEUS, and the obtained data may serve as reference values in the evaluation of renal perfusion using CEUS in dogs under anesthesia.
Contrast enhanced ultrasound (CEUS) uses gas-filled microbubbles as an intravascular tracer to evaluate tissue perfusion which can aid in diagnosing neoplastic, traumatic or necrotic lesions due to differences in blood flow [18, 22]. Microbubbles remain entirely within the intravascular space of the kidney with no interstitial diffusion or urine excretion and have a rheology similar to that of red blood cells. Therefore, they can function as blood pool markers and enable functional vascular imaging [9]. In humans, CEUS is used to evaluate a wide range of renal conditions. In critically ill patients, CEUS has been used to differentiate acute tubular necrosis from acute cortical necrosis, thereby improving decision-making and permitting a better informed prognosis [5]. CEUS also improves the detection of parenchymal lesions in patients with acute pyelonephritis [10] and facilitates early detection of chronic allograft nephropathy in renal transplants patients [19].
In veterinary medicine, there have been several studies for CEUS in normal canine kidney [1, 21] and in dogs with renal diseases [7] and experimentally induced diseases [4, 6]. In a study of renal perfusion in dogs with iatrogenic hypercortisolism, quantitative CEUS allowed detection of differences in renal blood flow between normal dogs and dogs treated with hydrocortisone [6]. Another study described the use of CEUS to detect changes in renal perfusion in chronic ischemia caused by renal artery obstruction [4].
In small animal practice, sedation or anesthesia may be required for uncooperative or panting patients, because patient motion interferes with the placement of the region of interest (ROI) during the analysis of CEUS images. Previous studies have indicated that sedative and injectable anesthetic agents can alter the time to peak enhancement of the liver and the pattern of enhancement in the spleen during CEUS [12, 15]. However, a study of the normal contrast enhancement pattern of the canine kidneys under general inhalation anesthesia reported that isoflurane had a minimal effect on contrast enhancement [21].
CEUS can be performed within a relatively short time (less than 5 min). Injectable anesthetics with minimal hemodynamic effects may be more useful than inhalation anesthesia during CEUS procedure. Therefore, it is necessary to evaluate the effect of injectable anesthetics on CEUS of canine kidneys.
The aim of this study was to evaluate the perfusion pattern of normal canine kidneys by analyzing the time-intensity curve using CEUS, and to compare the normal pattern to that observed under general anesthesia using injectable anesthetics. These data will be a valuable reference for evaluating clinical patients and for choosing anesthetic agents for CEUS examination.
MATERIALS AND METHODS
Experimental animals: This study was performed under the guidance of the Chungnam National University Animal Care and Use Committee. Eight beagle dogs (5 males and 3 females) ranging in weight from 5.8 to 9.6 kg (mean, 7.8 kg) were used in this study. The age of the dogs ranged from 2 to 3 years. Physical examination and clinical laboratory analyses including complete blood counts, serum biochemistries (total protein, albumin, globulin, blood urea nitrogen, creatinine, glucose, cholesterol, total bilirubin, alkaline phosphatase, alanine aminotransferase, calcium phosphorus, potassium and sodium) and urinalysis were used to assess their health status. Abdominal radiography and ultrasonography revealed no focal or diffuse kidney abnormalities in any of the dogs.
Anesthetic/experimental protocol: All experimental animals were fasted for approximately 12 hr before ultrasound examination to minimize any artifacts caused by intestinal gas or gastrointestinal contents. All dogs underwent CEUS examinations three times at 7 days apart. The first scan was performed in conscious dogs (conscious group) using manual restraint, the second examination was performed under general anesthesia using a combination of tiletamine-zolazepam and medetomidine (TZM group), and the last scan was performed under general anesthesia using only medetomidine (M group). In the TZM group, tiletamine-zolazepam powder (Zoletile 50®, Virbac Animal Health, Carros, France), which is composed of 125 mg of tiletamine and 125 mg zolazepam, was rehydrated with 4.5 ml sterile saline and 0.5 ml medetomidine (Dormitor®, 1 mg/ml, Orion Pharmaceutical Co., Espoo, Finland) [14]. The mixture was administered intramuscularly at a dosage of 0.04 ml/kg. In the M group, medetomidine was administered at a dosage of 20 µg/kg by intramuscular injection.
CEUS technique: Before ultrasound examination, a 24-gauge intravenous (IV) catheter was placed in the cephalic vein for contrast agent injection. Hair was removed from a small area of the left flank, the skin was prepared using alcohol, and ultrasound gel was applied. CEUS images were obtained using the iU22® ultrasound system (Philips, Bothell, WA, U.S.A.) with a 5–12 MHz linear transducer capable of harmonic imaging. The dogs were positioned in dorsal recumbency. The sagittal or parasagittal plane of the left kidney was imaged, and the transducer was not subsequently moved. The contrast agent (Sonovue®, Bracco, Italy) was administered at a rate of 0.03 ml/kg (IV bolus) and followed by an immediate saline (5 ml) flush. Images were obtained for 90 sec after bolus injection of the contrast agent and recorded on the ultrasound internal storage system. Adjustable parameters, such as depth, gain and focal zones, were optimized and maintained in all dogs. The depth was set at 3.5 cm in order to access the entire renal parenchymal image and avoid the mesentery, fat tissue, large vessels (e.g., abdominal aorta, caudal vena cava) and adjacent organs (e.g., spleen, gastrointestinal tract). The gain was set at 80 to 82% for imaging the distal renal parenchyma. A focal zone was placed at the distal renal cortex. The mechanical index was set to 0.08 for minimal destruction of the microbubbles. Perfusion of the renal cortex and medulla was evaluated after IV bolus injection of microbubble contrast medium followed by saline flushing. Each procedure was repeated approximately 10 min after administration of anesthetic agents. This was the time needed for adequate induction of anesthesia in order to perform the CEUS procedure.
CEUS parameter analysis: Images were analyzed using an internal storage software program (Q Lab,® Phillips). The manually drawn ROIs were 3 × 3 mm2 and located in the middle of the renal cortex and medulla at a depth between 1 cm and 1.5 cm at the caudal pole. The program calculated the mean echo-intensity for each ROI area. The echo-intensity data within the renal cortex and medulla were plotted over time to produce time-intensity curves. The functional renal perfusion parameters were evaluated from the time-intensity curves based on the previous definitions [8, 21] (Fig. 1). The peak intensity (PI) means the maximum enhancement of the renal cortex and medulla representing renal blood volume. The times to peak enhancement (TTP) were measured as TTP0 and TTPup. TTP0 was defined as the time to peak enhancement from the time of contrast agent injection. TTPup was the time to peak enhancement from the time when the contrast agent first reached the kidney. The upslope and the downslope were obtained from the data points of time-intensity curve between 10% above baseline and 85% of the PI in the renal cortex and medulla. Therefore, the use of the top and bottom echo-intensity values was avoided in the time-intensity curve. These parameters indirectly reflected the wash-in and wash-out rates. The area under the curve (AUC), which indirectly measures the mean renal blood flow, was measured from the time-intensity curve.
Figure 1: Scheme of a time-intensity curve with contrast enhanced ultrasonography parameters from a representative dog. The x-axis represents time in seconds and the y-axis represents intensity in decibels. The following functional parameters were derived from the curve: PI (dB) indicates peak intensity; TTP0 (sec) is the time to peak enhancement from the time of contrast agent injection; TTPup (sec) is the time to peak enhancement from the time when the contrast level is initially above baseline; upslope (dB/sec) and downslope (dB/sec) are regression lines of the time-intensity curve between 10% above baseline to 85% of the PI.

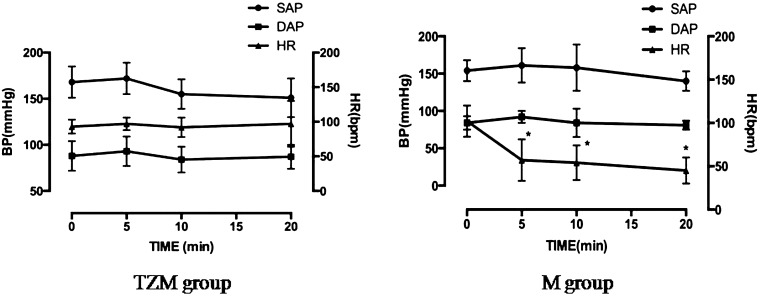
Heart rate and blood pressure monitoring: The heart rate (HR) and indirect blood pressure [(BP): systolic arterial pressure (SAP), mean arterial pressure (MAP) and diastolic arterial pressure (DAP)] were measured and recorded at time 0 (before anesthetics injection) and at 5, 10 and 20 min after anesthetics administration using a patient monitor (VP-700®, Votem, Chuncheon, Korea) and oscillometric BP device (VET HDO monitor®, Vetline LCC Co., Babenhausen, Germany).
Statistical analysis: Repeated ANOVA was used to compare PI, upslope, downslope, TTP0, TTPup and AUC among the three groups of dogs. Bonferroni correction was applied to account for multiple comparisons. Repeated ANOVA was also used for comparison of HR and BP between the three groups with Bonferroni correction to account for multiple comparisons. For all analyses, P<0.05 was considered statistically significant. All statistics were performed using a computer statistical package (IBM SPSS Statistics for Windows, version 20.0, IBM Corp., Armonk, NY, U.S.A.).
RESULTS
Real-time observation of renal perfusion: The contrast ultrasound techniques were easy to perform, and contrast enhancement was clearly visible in both conscious, and anesthetized dogs. In conscious dogs, there was rapid, homogeneous contrast enhancement throughout the renal cortex; this enhancement was subjectively more hyperechoic than in the renal medulla. The cortex had a rapid initial inflow of contrast enhancement followed by a fade-out during which the medulla would begin to enhance. The initial contrast enhancement of the medulla was invariably more delayed than in the renal cortex and usually remained coarser and hypoechoic compared with the renal cortex in all dogs. The enhancement patterns of the cortex and medulla are displayed in Fig. 2. Subjectively, in anesthetized dogs (TZM and M groups), the enhancement pattern was similar to that of the conscious group. The enhancement wash-in was delayed. However, the degree of PI of the cortex and medulla, and the heterogeneity of contrast enhancement among the three groups did not differ. These observations are supported by objective results (Tables 1 andand 2Table 2).
Figure 2: Contrast enhanced images of the left kidney in different stages after a bolus injection of contrast agent. (A) 6 sec after the injection; base line; (B) 9 sec: the contrast agent is diffusely spread in the cortex; (C) 11 sec: the cortical enhancement has reached its peak; the medulla is not enhanced; (D) 15 sec: the contrast agent in the cortex is starting to fade; (E) 22 sec: the medullary perfusion is at its peak; (F) 70 sec: the contrast agent is fully washed out of the cortex and medulla.

Table 2: Mean and standard deviation of renal cortical perfusion parameters in dogsData are expressed as mean ± SD (n=8). TZM, tiletamine-zolazepam-medetomidine; M, medetomidine; TTP0, time to peak enhancement from contrast injection; TTPup, time to peak enhancement from initial rise; AUC, area under the curve. a) P<0.05 (Conscious group versus M group); b) P<0.05 (Conscious group versus TZM group); c) P<0.05 (TZM group versus M group).

Table 2: Mean and standard deviation of renal medullary perfusion parameters in dogsData are expressed as mean ± SD (n=8). TZM, tiletamine-zolazepam-medetomidine; M, medetomidine; TTP0, time to peak enhancement from contrast injection; TTPup, time to peak enhancement from initial rise; AUC, area under the curve. a) P<0.05 (Conscious group versus M group); b) P<0.05 (Conscious group versus TZM group); c) P<0.05 (TZM group versus M group).

Quantitative analysis of renal perfusion: Representative time-intensity curves from each group are shown in Fig. 3. Compared to the cortical perfusion parameters in the conscious group, TTP0 was significantly delayed in the TZM group, while the upslope, TTP0 and TTPup differed significantly in the M group (P<0.05). The AUC of the cortex in the TZM and M groups was not different with that of the conscious group (Table 1). Analysis of renal medullary parameters (Table 2) showed significantly decreased upslope in the TZM and M groups (P<0.05). TTP0 and TTPup were significantly delayed in the TZM and M groups (P<0.05). The AUC of the medulla was significantly decreased in the M group (P<0.05) compared with the concious and TZM groups. The upslope, TTP0 and TTPup of the M group were significantly different from those of the TZM group (P<0.05).
Figure 3: Time-intensity curves obtained from three representative dogs from the A) conscious group, B) TZM group and C) M group.

HR and BP: Data related to HR, SAP, MAP and DAP are shown in Fig. 4. There were no significant differences in SAP, MAP and DAP between anesthetized and conscious dogs. However, in the M group, the HR was significantly lower 10 min and 20 min after administration of medetomidine compared to the HR before anesthetic injection (P<0.0083).
Figure 4: Blood pressure and heart rate following administration of anesthetics in the tiletamine-zolazepam and medetomidine (TZM) and metetomidine (M) groups.
DISCUSSION
In this study, the contrast enhancement pattern (Fig. 3) of the conscious group was similar to that in previous CEUS reports of the normal canine kidneys [13, 21]. However, intensity parameters are difficult to compare with the previous results, because intensity is easily affected by variable machine settings, such as gain, transducer frequency and the mechanical index. However, these factors do not affect the slope or time to peak [21]. In the present study, the mean time to peak was 10.33 ± 1.73 sec in the renal cortex and 16.56 ± 2.69 sec in the renal medulla. One study on CEUS of kidneys in eight dogs showed relatively delayed mean time to peak compared with our results. This discrepancy was thought to be due to the differences in the speed and volume of contrast agent injection, volume of saline flush and patient factors like cardiac output or blood pressure, which can be affected by anesthetic protocols. In addition, body weight can cause the discrepancy of the results. Our dogs were smaller than those in the previous study (8–25 kg). In a CEUS study on normal canine spleens, the association between body weight and the perfusion variables was evaluated between small dogs (≤15 kg) and larger dogs (≥15 kg). The time to peak intensity and AUC were lower in small dogs, indicating overall perfusion is lower and the rate of inflow is faster than those in larger dogs [16]. However, their results were not statistically significant. Therefore, renal perfusion variables should be evaluated with respect to body weight.
Both the size and location of the ROI can have an effect on the echo-intensity value. The larger or deeper the ROI, the lower the PI [13]. ROI size is recommended to be large enough to represent the tissue being analyzed, but small enough to avoid the surrounding structure and vessels, and the ROI placement for perfusion quantification should be where enhancement is the most homogeneous and close to the focal zone [13]. Therefore, in this study, the size of the ROI was designated as 3 × 3 mm2, which was large enough to include the parenchyma of the kidney without interference from large vessels or respiratory motion. The depth of the ROI was set between 1 and 1.5 cm to avoid attenuation of tissue and analyze the most homogeneous part of the kidney parenchyma. In this study, standardization of the ROI size and location resulted in PI values of the cortex and medulla that did not differ between the groups.
Compared to the conscious group, the M group had a significantly delayed TTP0 and TTPup of the cortex and medulla. These results might be caused by decreased cardiac output and HR after medetomidine administration [3]. In this study, cardiac output was not measured, but likely decreased. The HR decreased significantly after 10 min following administration of medetomidine in the M group (Fig. 4). Decreased cardiac output and HR affect the renal blood flow; therefore, the slowly infused contrast agent reaching the kidneys resulted in delayed TTP0 and TTPup. Because the upslope value was calculated based on TTPup and an increase in echo-intensity, the delayed TTPup primarily affected the upslope values of the renal cortex and medulla. The effect of medetomidine can be rapidly reversed with a specific alpha 2-adrenoceptor antagonist, atipamezole. This is an advantage for simple procedure like CEUS [3]. However, the side effects of medetomidine caused marked bradycardia, and hence, decreased cardiac output resulted in remarkable changes in renal perfusion parameters during CEUS in dogs receiving only medetomidine in this study.
By minimizing the dose of medetomidine in the TZM group, HR and BP were maintained during anesthesia. The blood flow rate to the kidney seemed to be minimally affected in the TZM group. Therefore, there were no changes in the perfusion parameters, except for the TTP0 in the cortex. Although the combination of anesthetics was different from the present study, a previous report described that a medetomidine-midazolam-butorphanol combination decreases intestinal and skeletal muscle microvascular blood flows, while renal cortical blood flow is maintained in dogs [17]. In that study, renal medullary flow was not examined. In another study on the effects of iatrogenic hypercortisolism on kidneys in dogs, renal medulla showed similar changes with those of cortex, which reflect that medullary blood flow depends on changes in cortical flow [6]. However, renal cortical and medullary blood flows have been reported to react differently to arterial chemoreceptor stimulation anesthetics [11]. When renal blood perfusion parameters in the renal medulla were compared with those of the cortex in the present study, TTPup and upslope also changed under TZM anesthesia. These results are presumably because this anesthetic combination induced different reactions in the renal cortex and medulla. PI, AUC and down slope in the renal medulla did not show significant changes like those of the cortex, which suggests that renal medullary blood volume was maintained under TZM anesthesia.
Our study has several limitations. Firstly, we examined only the left kidney (left kidney), because it is impossible to perform CEUS on both kidneys simultaneously. A study that evaluated glomerular filtration rate with dynamic computed tomography in normal dogs reported that contrast agent concentrations and glomerular filtration rate were not significantly different between the left and right kidneys [2]. Therefore, it is thought that the perfusion of one kidney is similar to the other. Secondly, 24-gauge IV catheters were used in this experiment, and injections were performed manually. These techniques can cause possible microbubble destruction and injection time variability. In a study of the effect of needle size and injection rate on microbubble contrast agent population, a 23-guage needle was relatively nondestructive to microbubble contrast agents [20]. The authors reported needles smaller than 27-gauge and rapid injection rate to be the major factors associated with microbubble destruction. Therefore, usage of 24-gauge needles should not have caused significant microbubble destruction, however, larger catheters should have been used in this experiment. Thirdly, inter-observer and intraobserver variability was not evaluated in this study, although CEUS examinations are known to be examiner-independent. Lastly, necropsy and histopathologic confirmation of the kidney condition were not performed in all dogs in this study.
In conclusion, renal cortical perfusion pattern under TZM anesthesia was not significantly different with conscious status, except for TTP0. However, perfusion factors in the renal medulla were affected by anesthesia during CEUS. Therefore, the TZM combination may be a useful anesthetic protocol for evaluating renal cortical perfusion, and data obtained in this study may serve as reference values for evaluation of renal perfusion using CEUS in dogs under the injectable anesthesia
Acknowledgments
This work was supported by research fund of Chungnam National University.
REFERENCES
Share this article / Teilen Sie diesen Artikel